If you’re running a kubernetes environment, you probably need to collect logs from your pods.
You’ve got different choices from paid to opensource tool, in this post, I’ll choose fluentbit because it’s lightweight and has a helm chart I can use.

Concept
Logging in kubernetes is something dynamic, every new application running in the cluster should be able to send his logs without any human intervention. Thanks to daemonSet object, which allow us to run a pod on any nodes inside a cluster.
I remember few years ago, when I used nagios and I had to add manually every single new host to be able to monitor it. It was painful.
The log stream is represented by this diagram
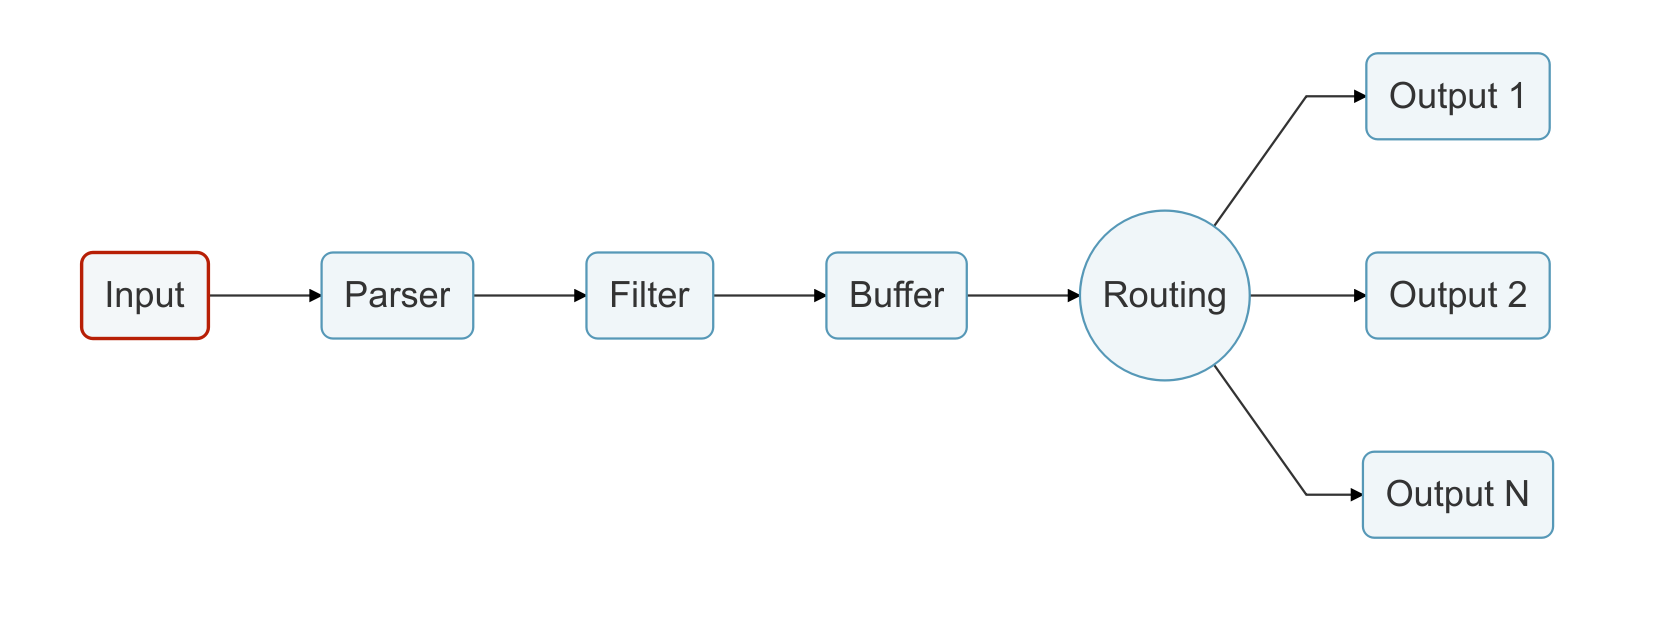
This log stream is declared in different sections inside fluent-bit.conf
Service (not present on diagram): the global configuration of fluentbit
Input: the source of logs file, could be syslog, tail, tcp, docker event
Parser: Read the source, find pattern and transform the structure.
Filter: Enrich your logs with new metadatas
Buffer: When data is ready to be senf to the destination (output), fluentbit keep it in memory by default
Output: Where to send datas (elasticsearch, influxdb, kafka, splunk…)
Requirements
- A functional Elasticsearch
- A functional Kibana
- Kubernetes installed (I used k3s, but you can use any installer)
- Helm installed. (I used Helm3, but you can also use version2 as well.)
Install fluentbit
Before started, make sure you have all requirements above.
Fetch the last values.yaml file from official stable repo.
wget https://github.com/helm/charts/blob/master/stable/fluent-bit/values.yaml
You need to replace type, host and port. Optionnaly, also replace http_user, http_passwd, tls and tls_verify if your elasticsearch cluster has TLS enabled.
backend:
  type: es
  forward:
    host: fluentd
    port: 24284
    tls: "off"
    tls_verify: "on"
    tls_debug: 1
    shared_key:
  es:
    host: "172.31.36.188"
    port: 9200
    # Elastic Index Name
    index: kubernetes_cluster
    type: flb_type
    logstash_prefix: kubernetes_cluster
    replace_dots: "On"
    logstash_format: "On"
    retry_limit: "False"
    time_key: "@timestamp"
    # Optional username credential for Elastic X-Pack access
    http_user: YOURUSER
    # Password for user defined in HTTP_User
    http_passwd: YOURPASSWORD
    # Optional TLS encryption to ElasticSearch instance
    tls: "on"
    tls_verify: "off"
Deploy fluentbit. Configuration set above will be store as a configMap.
helm install my-release stable/fluent-bit -f values.yaml
Verify everything is ok in the pod
kubectl logs -f my-release-fluent-bit-7vgv9

Fluent Bit v1.3.7
Copyright (C) Treasure Data

[2020/08/12 18:44:46] [ info] [storage] initializing...
[2020/08/12 18:44:46] [ info] [storage] in-memory
[2020/08/12 18:44:46] [ info] [storage] normal synchronization mode, checksum disabled, max_chunks_up=128
[2020/08/12 18:44:46] [ info] [engine] started (pid=1)
[2020/08/12 18:44:46] [ info] [filter_kube] https=1 host=kubernetes.default.svc port=443
[2020/08/12 18:44:46] [ info] [filter_kube] local POD info OK
[2020/08/12 18:44:46] [ info] [filter_kube] testing connectivity with API server...
[2020/08/12 18:44:46] [ info] [filter_kube] API server connectivity OK
[2020/08/12 18:44:46] [ info] [sp] stream processor started
If connection cannot be made with elasticsearch, you will have errors like below
...
[2020/08/12 18:26:45] [ info] [sp] stream processor started
[2020/08/12 18:26:46] [ warn] [engine] failed to flush chunk '1-1597256805.831884794.flb', retry in 8 seconds: task_id=3, input=tail.0 > output=es.0
[2020/08/12 18:26:46] [ warn] [engine] failed to flush chunk '1-1597256805.900629707.flb', retry in 6 seconds: task_id=5, input=tail.0 > output=es.0
[2020/08/12 18:26:46] [ warn] [engine] failed to flush chunk '1-1597256805.935252212.flb', retry in 9 seconds: task_id=6, input=tail.0 > output=es.0
...
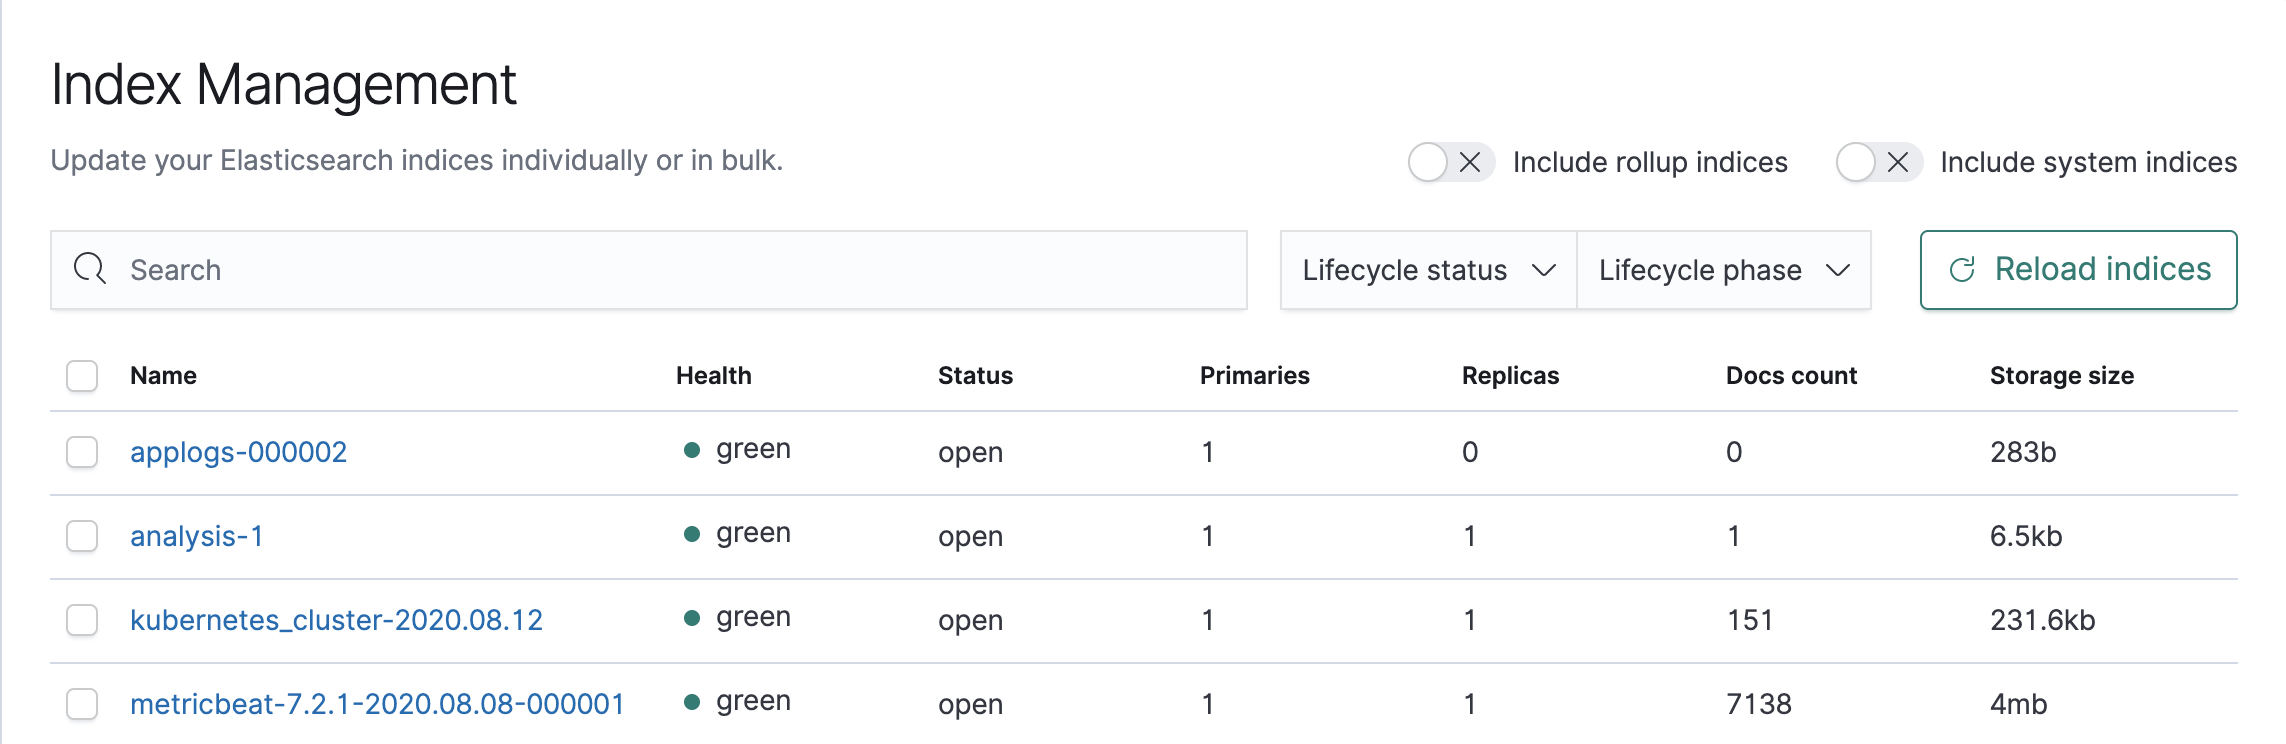
Verify Elasticsearch received datas and created the index
Fluentbit creates daily index with the pattern kubernetes_cluster-YYYY-MM-DD, verify that your index has been created on elasticsearch.
If everything is ok, you can create an index pattern with kubernetes*, which will allow you to display the index documents from the UI.
Generate logs and verify they appear on Kibana
I used this project ro generate random logs: https://github.com/mingrammer/flog
kubectl run log-gen --image mingrammer/flog
You should now see your logs with all kubernetes metadatas added by fluentbit.

Conclusion
This is a sample of what you can do with log collection in a kubernetes cluster, there’s actually a lot of engineering behind like define a standard for logs coming from different formats across your platform or high availability setup.
Peace out ;)